
BIND Memory Management Explained
The Basics The basic BIND 9 memory management object is a memory context: the application can have as many as is practical.
Read postThe basic BIND 9 memory management object is a memory context: the application can have as many as is practical. There are two reasons for a separate memory context: a) logical separation - this includes both separate accounting, and different configuration, and b) contention and speed - access to a memory context pinned on a specific thread will not be blocked by different threads.
The configuration option max-cache-size only affects the memory context in the cache and ADB (address database). All other memory contexts are unconstrained. This means setting the max-cache-size to 100% would lead to the OOM Reaper finding your BIND 9 process and killing it.
There are two reasons for this:
BIND 9.18 uses less memory than 9.16, similar to the memory usage in 9.11. The part that sends and processes outgoing DNS messages (server side) was refactored to use the new networking code and therefore uses half as many threads as BIND 9.16 used.
The other major change implemented in BIND 9.18 was the replacement of the internal memory allocator with the jemalloc memory allocator. The internal memory allocator kept pools of memory for later reuse and would never free up the reserved memory. The jemalloc memory allocator is much better suited to the memory usage patterns that BIND 9 exhibits and is able to be both fast and memory efficient.
Our general recommendation for all deployments is to use jemalloc if possible. You can use jemalloc with BIND 9.16 by forcing the linkage via extra LDFLAGS (./configure LDFLAGS="-ljemalloc" should do the trick).
Measuring real memory usage can be tricky, but fortunately, there are some tools to help with that.
The statistics channel exposes counters for memory contexts. The important values are ‘InUse’ and ‘Malloced’. The ‘InUse’ counter shows the memory used “externally” and ‘Malloced’ includes the management overhead (the more memory contexts the more overhead there is).
You can use this attached memory-json.py script to parse the statistics channel output to receive following data (this is from main branch):
OpenSSL: 268.8KiB 277.0KiB
uv: 6.1KiB 14.3KiB
libxml2: 1.0KiB 9.2KiB
<unknown>: 9.2KiB 17.4KiB
main: 1.4MiB 1.5MiB
loop: 10.8MiB 10.8MiB
zonemgr-mctxpoo: 20.5KiB 86.1KiB
clientmgr: 768.0B 66.4KiB
cache: 31.9KiB 48.3KiB
cache_heap: 2.1KiB 18.5KiB
ADB: 525.7KiB 542.1KiB
SUMMARY
INUSE: 13.1MiB == 13.1MiB
MALLOCED: 13.3MiB == 13.3MiB
The rule of thumb is “Don’t use the ‘top’ command” - there are better tools that are less misleading. There are two tools the are easily available on modern Linux systems - pmap and smem.
pmap provides detailed statistics, but can be too chatty - the basic usage is pmap -x -p <pid>. It prints information about all pages used by the program which includes shared libraries, the program itself, and the heap. The important number is the last one, “Dirty” - it shows the memory “used” by BIND 9.
Example pmap output could look like this:
$ pmap -x -p $(pidof named)
3301879:   /usr/sbin/named -4 -g -c named.conf
Address           Kbytes     RSS   Dirty Mode  Mapping
000055872b587000      88      88       0 r---- /usr/sbin/named
[...too many lines...]
00007ffc52753000     132      40      40 rw---   [ stack ]
00007ffc527c1000      16       0       0 r----   [ anon ]
00007ffc527c5000       8       4       0 r-x--   [ anon ]
---------------- ------- ------- -------
total kB          760180   74324   60708
smem provides fewer details, so if you want only a single number, run smem -P named and look for the USS column - this provides the information about memory used by the program sans the shared library. The PSS column adds shared libraries divided by the number of programs using those libraries, and RSS is the normal Resident Size.
$ smem -P named -a
    PID User   Command                             Swap   USS   PSS   RSS
3301879 ondrej /usr/sbin/named -4 -g -c named.conf    0 69664 70201 74324
There are couple of reasons that the numbers reported by the BIND 9 statistics channel might differ from the memory usage reported by the operating system.
External libraries
BIND 9 uses several external libraries - OpenSSL, libuv, libxml2, json-c and possibly others. All these also need memory from the operating system to operate. The difference should not be large, but it’s also not negligible. If the difference between the used memory reported by the internal statistics channel and USS is large (on a busy server), then congratulations, you’ve found a leak in an external library. (NOTE: BIND 9.19 - the development version - provides its own memory context for OpenSSL, libuv, and libxml2 if the library versions are recent enough.)Memory fragmentation
There’s quite a lot of churn in memory allocations and deallocations on a busy server, and memory gets fragmented - the default Linux allocator isn’t particularly good with the BIND 9 memory usage patterns. Using jemalloc is strongly recommended as it handles memory fragmentation much better and is also faster.When compiled (or even linked using LD_PRELOAD), jemalloc can produce heap snapshots based on triggers (time, size, …). This can be later analysed using the jeprof tool to see where the memory went.
The basics are:
export MALLOC_CONF="abort_conf:true,prof:true,lg_prof_interval:19,lg_prof_sample:19,prof_prefix:jeprof"
export LD_PRELOAD=/usr/lib/x86_64-linux-gnu/libjemalloc.so.2 # you don't need that if compiled with jemalloc
/usr/sbin/named # use your normal options and configuration that you use in production
You’ll probably need to fine tune the lg_prof_interval and lg_prof_sample numbers (it’s log base 2) to get the desired file size.
After running the benchmark or a regular workload, you should end up with bunch of jeprof.<pid>.<m>.i<n>.heap files. Pick the latest and run:
jeprof \
	--show_bytes \
	--nodefraction=0 \
	--exclude="default_memalloc|mem_get|isc___mem_get|isc__mem_get|mem_allocateunlocked|isc___mem_allocate|isc__mem_allocate|isc___mem_strdup|isc__mem_strdup" \
	/usr/sbin/named **HEAP FILE** --pdf > "jeprof.pdf"
More options can be found in the jeprof manual page. These must be interpreted with knowledge of the BIND 9 internals. That said, if you are reporting what you think is a memory issue, attaching output of the jeprof will certainly help.
Below is a graph comparing memory usage in BIND 9.11, 9.16, 9.18, and 9.19 (aka main).
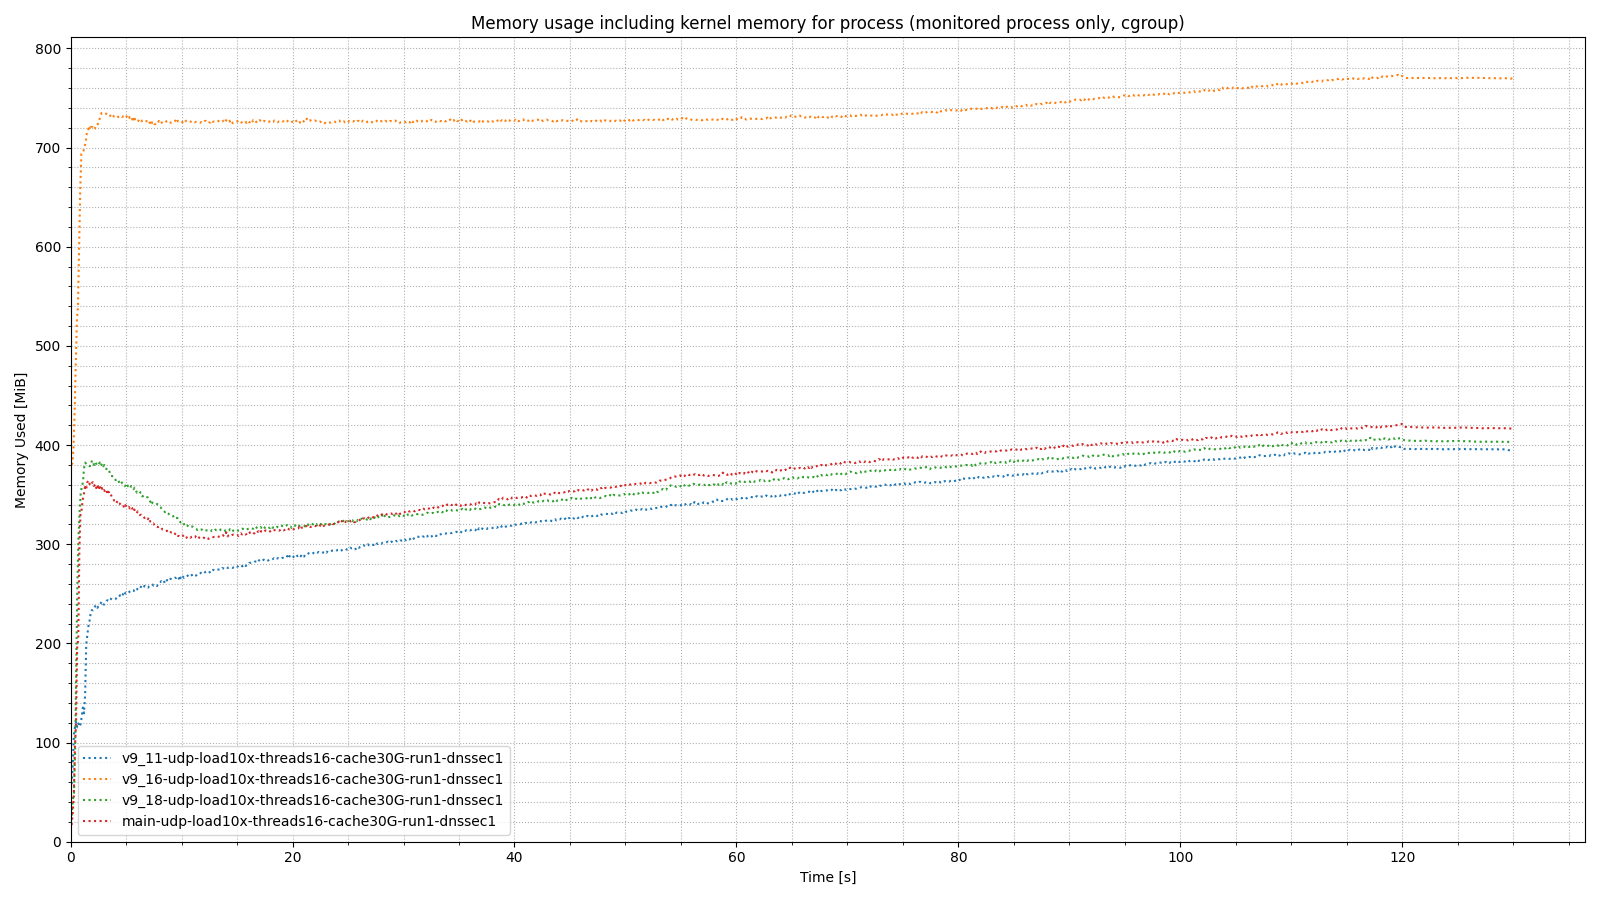
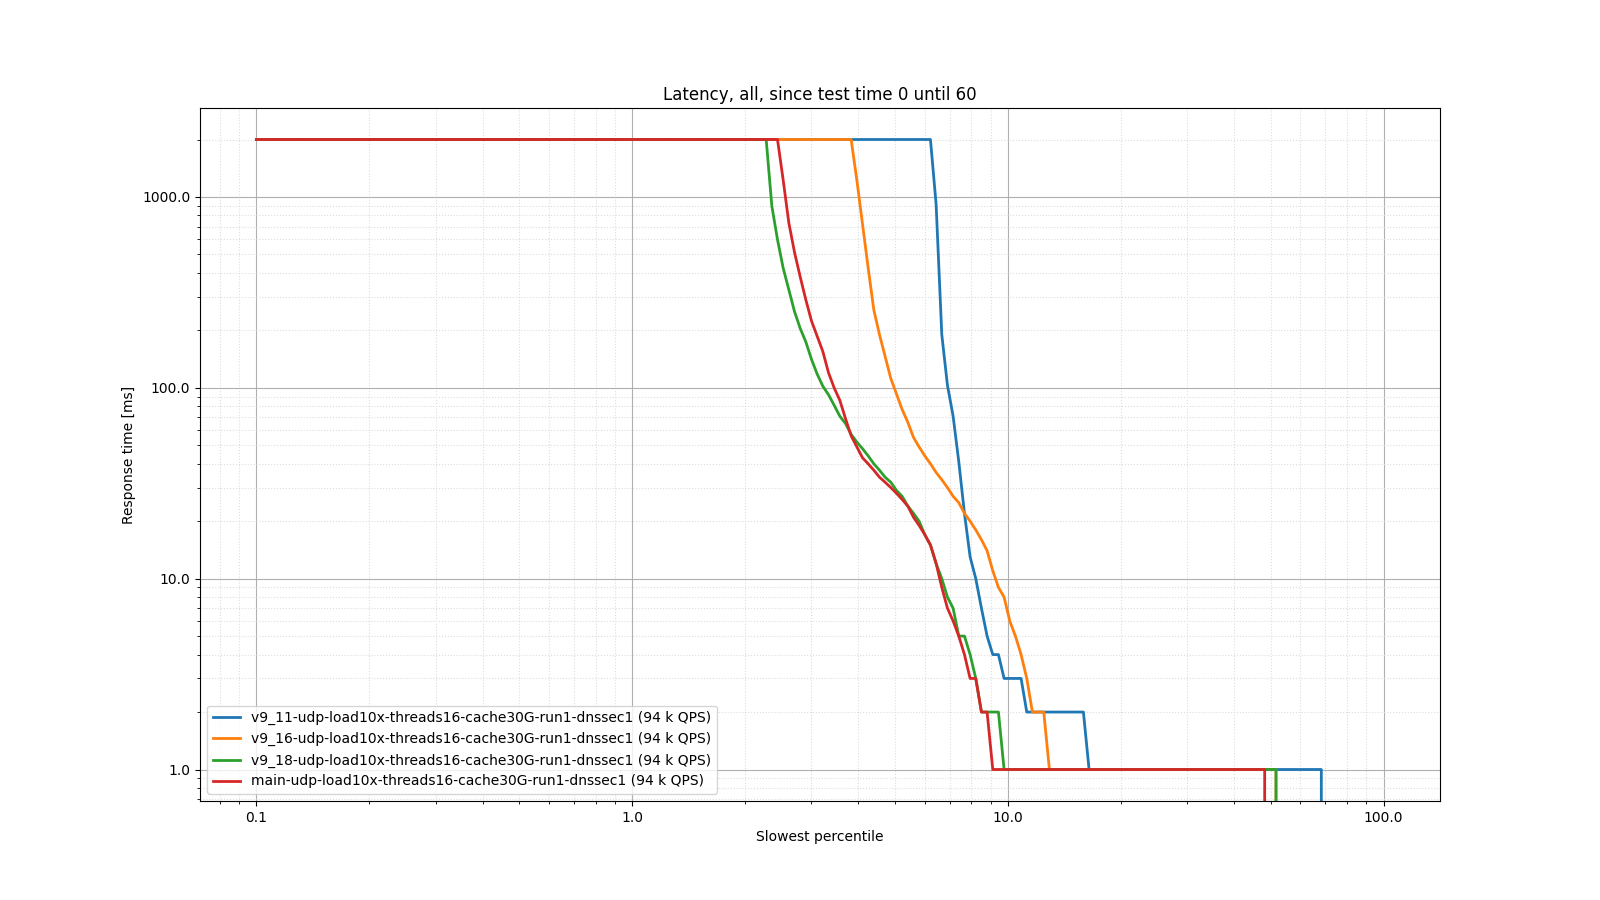
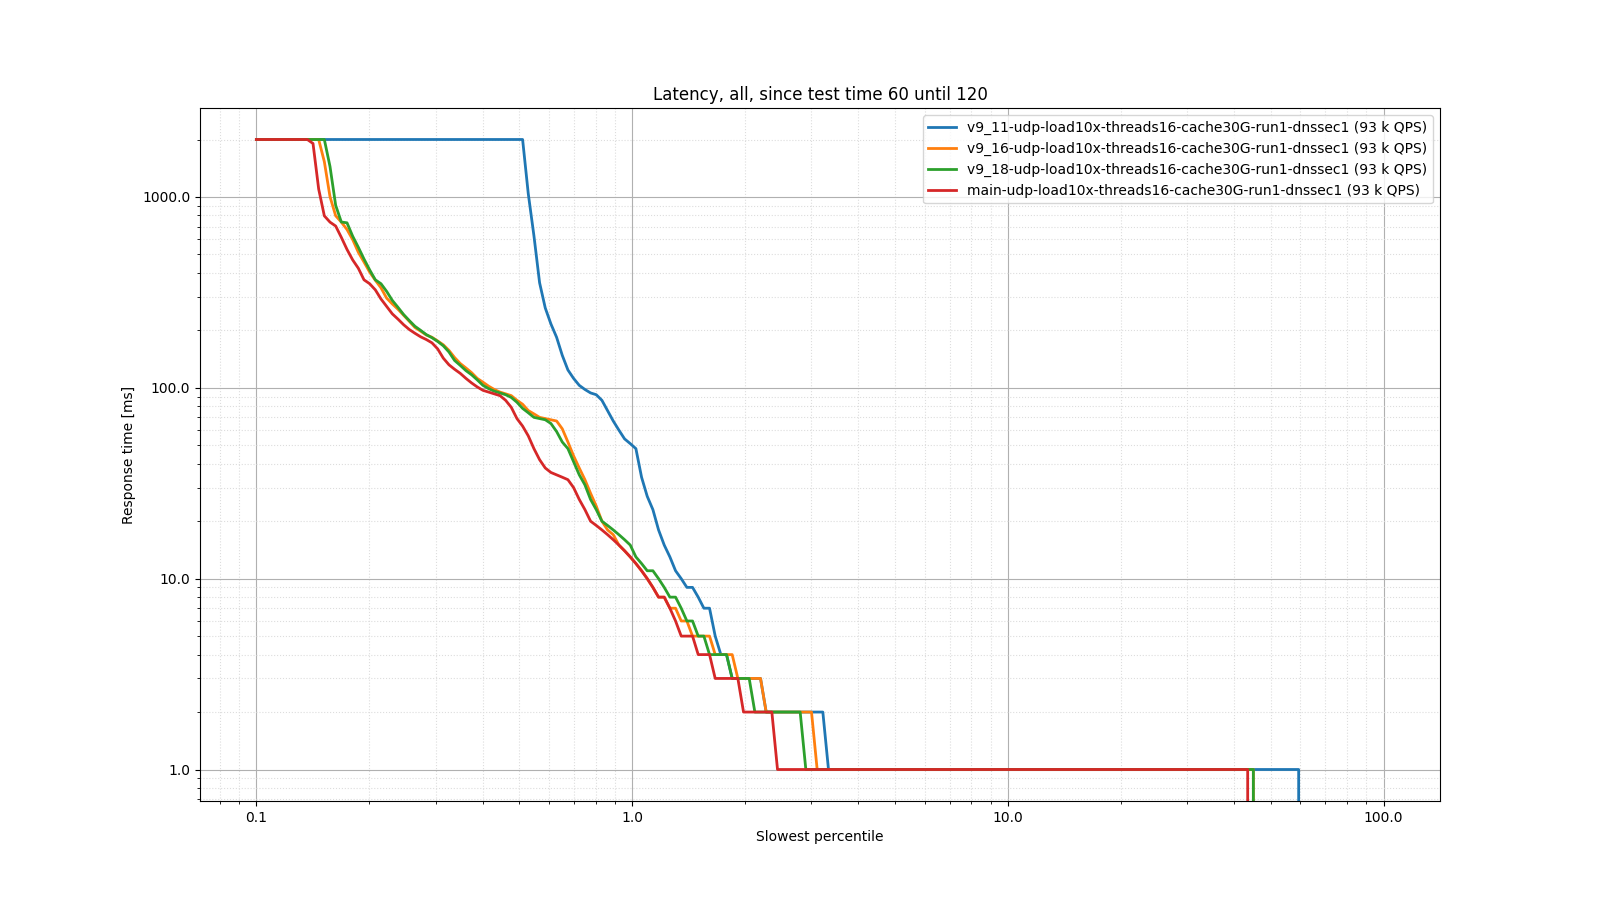
As you can see, 9.18 and 9.19 memory usage is in the same ballpark as 9.11. 9.16 uses twice as much memory (because it uses double the number of worker threads, as explained above). The following two graphs show that despite this improved memory usage, 9.18 and 9.19 actually have lower latency than 9.11.
This blog was originally posted on the BIND 9 development wiki page. Check there for further updates if this topic is very interesting to you.
What's New from ISC

The Basics The basic BIND 9 memory management object is a memory context: the application can have as many as is practical.
Read post
At the end of 2022, we are introducing some changes to the tools and procedures we use for signing the source code releases of our software, to make the whole process simpler and more robust.
Read post